White papers and reports
Reports on workplace learning where data is easy to read, not just scroll through.
Sector:
B2B e-learning
Scope:
Editorial design, Data visualisation, Infographics
Masterplan.com published white papers, reports and guides on workplace learning: onboarding, training needs, upskilling and future skills. Each one usually had 30 to 40 pages and reached clients as a downloadable PDF or in print. I designed around 12 of them, from the cover to the last chart.

The brief
The reports were full of data, survey results and expert content. They had to be laid out so readers wouldn't get lost after a few pages and the key numbers would stand out right away. Each report covered a different topic, sometimes created with a partner, but they all had to look like publications from one brand.


Our answer
Once I received the content, I designed the whole publication: the cover, page layouts, chapter openers and every graphic. I broke long text into clear chapters with large numbers, and mixed in photos and highlighted quotes so readers get a breather. Covers got strong images and a clear title, so each report caught the eye on its download page.
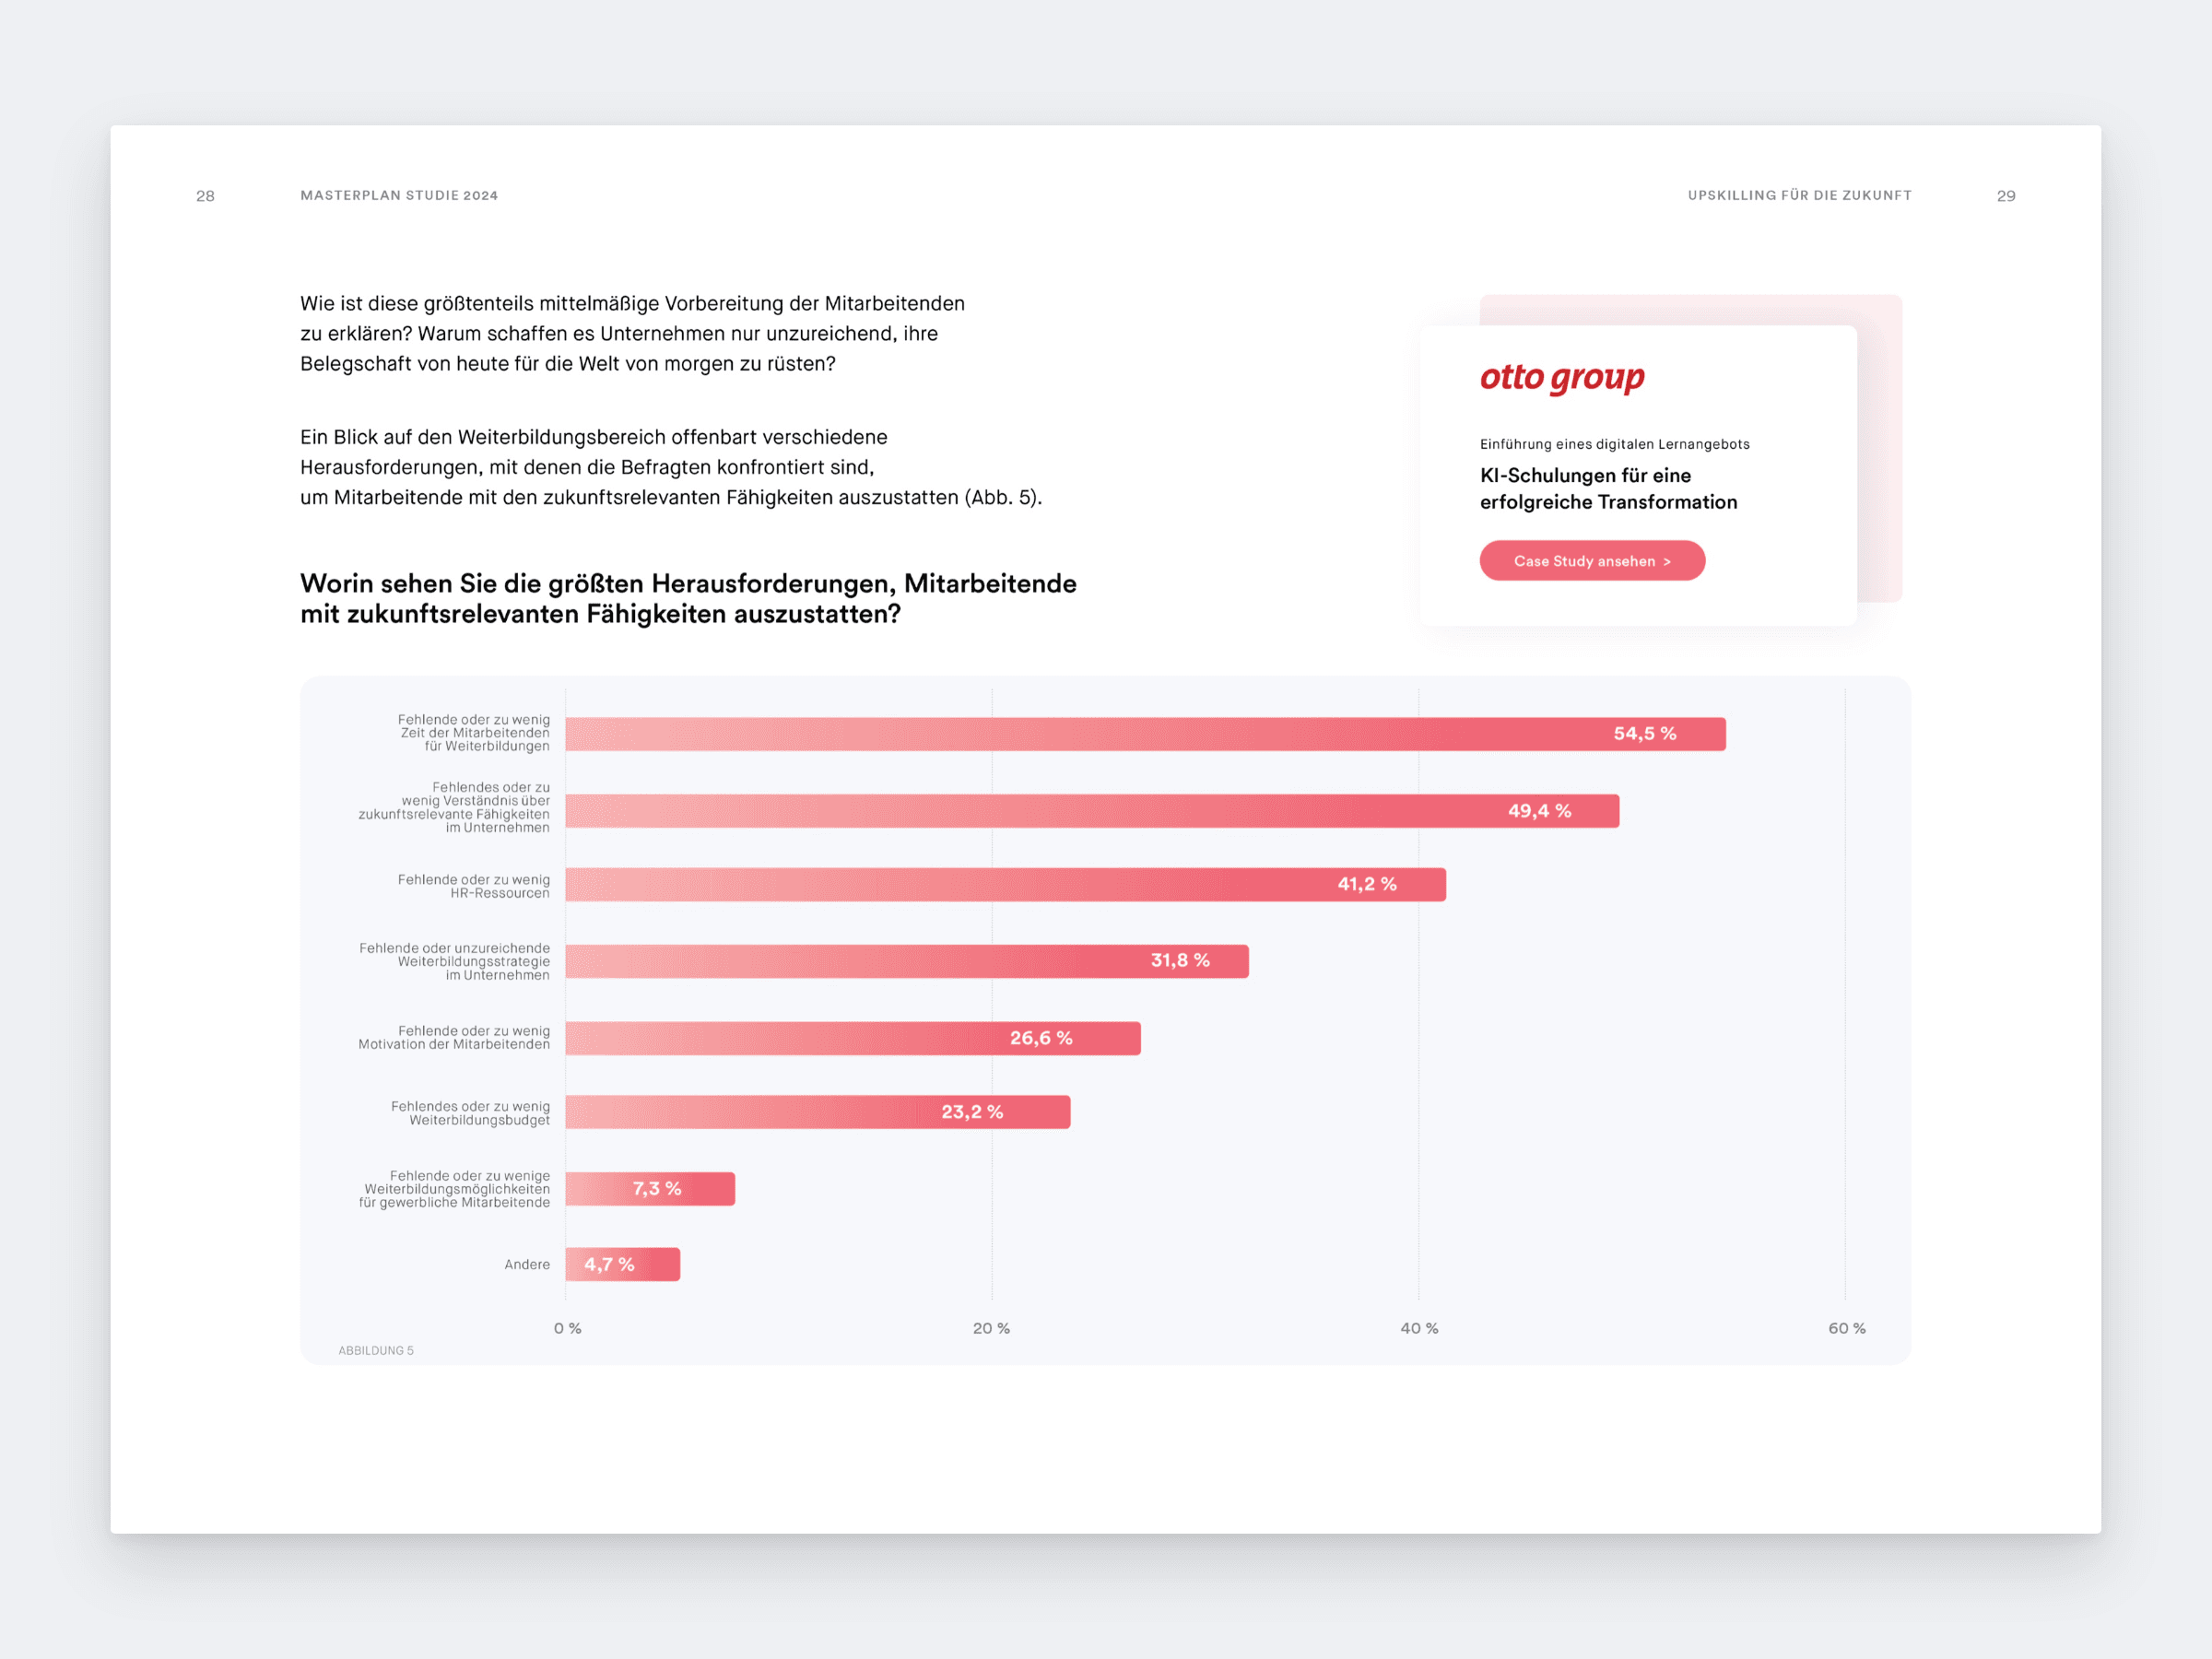


Data and charts
I turned survey results into simple charts in the brand colours, where the key point is clear at a glance. Each chapter ends with a short summary, so even someone just skimming the report takes away the main conclusions.
Data and charts
I turned survey results into simple charts in the brand colours, where the key point is clear at a glance. Each chapter ends with a short summary, so even someone just skimming the report takes away the main conclusions.


Infographics
Alongside the reports, I created separate infographics: an onboarding timeline step by step, metrics for learning success and an overview of the skills companies will need. Over time I developed a shared style for them, but each one is a little different, because each tells a different story.


The outcome
The reports and infographics were used in many places, including masterplan.com as downloadable publications, and supported lead generation. Thanks to a consistent style, each new publication was instantly recognisable as part of one Masterplan series.
The outcome
The reports and infographics were used in many places, including masterplan.com as downloadable publications, and supported lead generation. Thanks to a consistent style, each new publication was instantly recognisable as part of one Masterplan series.


